Wellbeing Metrics Dashboard for Leadership: 2026 Essentials
Andy Nadal
Author
A CEO spots the signs first. Teams drag. Output stalls at 70% capacity. He pulls up his wellbeing metrics dashboard for leadership . Burnout scores spike in sa...
A CEO spots the signs first. Teams drag. Output stalls at 70% capacity. He pulls up his wellbeing metrics dashboard for leadership. Burnout scores spike in sales. He acts fast: targeted check-ins, workload shifts. Result? Productivity jumps 25%. Turnover drops.
That's no fluke. A wellbeing metrics dashboard pulls employee health data into real-time views. It links stress levels to revenue hits. Leaders see patterns others miss.
Now, in April 2026, pressure mounts. AI personalizes alerts. ISO 45003 demands psychological risk tracking. Boards want proof wellbeing pays. You face talent wars and $438 billion in yearly disengagement losses. This dashboard turns vague worries into fixes.
You get better retention. Decisions sharpen. Teams thrive. This post breaks it down: reasons to adopt now, key metrics, build steps. Read on. Act soon.
The Top Reasons Leaders Are Turning to Wellbeing Dashboards Today
Leaders ditch perks alone. They demand data. Wellbeing dashboards integrate into performance reviews. C-suite owns it like sales targets.
Trends hit hard in 2026. Enterprise systems embed wellbeing. AI predicts drops before they tank output. Ecosystems go beyond apps; they tie to workflows.
Data backs it. Strong programs boost productivity 20-25%. Turnover falls. Compliance with ISO 45003 guidelines shields from investor scrutiny.
Not feel-good fluff. Risks loom large. Poor health signals lawsuits, board fights. Dashboards flag them early.
Value on investment matters most. Track VOI: output gains minus costs. Boards nod when revenue links show clear.

How AI and Real-Time Data Drive Smarter Leadership Choices
AI spots burnout weeks out. It scans surveys, app use. Patterns emerge: high stress in engineering.
Real-time pulses replace yearly checks. A dip triggers alerts. You pair it with empathy; tech flags, humans fix.
For example, manager training needs pop up. Low psychological safety scores highlight them. Secure handling keeps trust.
Therefore, choices speed up. No more guesses.
Tying Employee Health to Bottom-Line Business Wins
Health cuts healthcare bills. Retention saves big; replace costs eat profits.
Disengagement drains $438 billion yearly. Dashboards link it to output. Board reports get simple: health up, revenue follows.
One firm sees 20% gains. They track absenteeism drops. Governance demands it now.
In short, wellbeing fuels wins.
Must-Have Wellbeing Metrics for Your Leadership Dashboard
Pick metrics that tie to business. Skip vanity stats. Focus on health, engagement, output, personal factors.
Core ones: burnout rates from surveys. Engagement via pulses. Productivity trends. Retention links. Financial stress flags.
Visualize smart. Use line charts for trends. Heat maps for teams. Gauges for risks.
Categories matter. Health covers stress scores. Engagement hits morale. Business tracks ROI. Personalized adds money woes.
Here's a quick view:
| Metric Category | Key Trackers | Why It Matters |
|---|---|---|
| Health | Burnout scores, absenteeism | Cuts downtime 20-25% |
| Engagement | Pulse surveys, safety feels | Boosts loyalty |
| Business | Productivity, retention | Ties to revenue |
| Personalized | Financial stress, app use | Prevents quiet quits |
This setup drives action. Leaders scan, decide.

Tracking Burnout and Mental Health to Prevent Costly Downtime
Stress scores lead. Anonymous surveys feed them weekly.
Absenteeism follows. Spikes signal trouble.
Visuals: bar charts by department. Trends predict 20-25% output lifts when fixed.
You act: coaching, time off. Downtime shrinks.
Measuring Engagement and Team Trust for Stronger Culture
Pulse surveys hit psychological safety. Do teams speak up?
Global disengagements cost billions. Track manager KPIs here.
Gauges show trust levels. Low? Train fast.
Culture strengthens. Output holds.
Monitoring Productivity and Financial Resilience Links
Link output to health data. Retention rates flag risks.
Financial stress metrics cut turnover. VOI shines: savings beat costs.
Charts overlay trends. You see direct hits.
Steps to Build and Roll Out Your Own Wellbeing Dashboard
Start with business ties. No isolated tools. Integrate HR systems first.
Use secure AI ethically. Keep visuals simple. Real-time rules.
Set leader KPIs. Boost participation with clear wins.
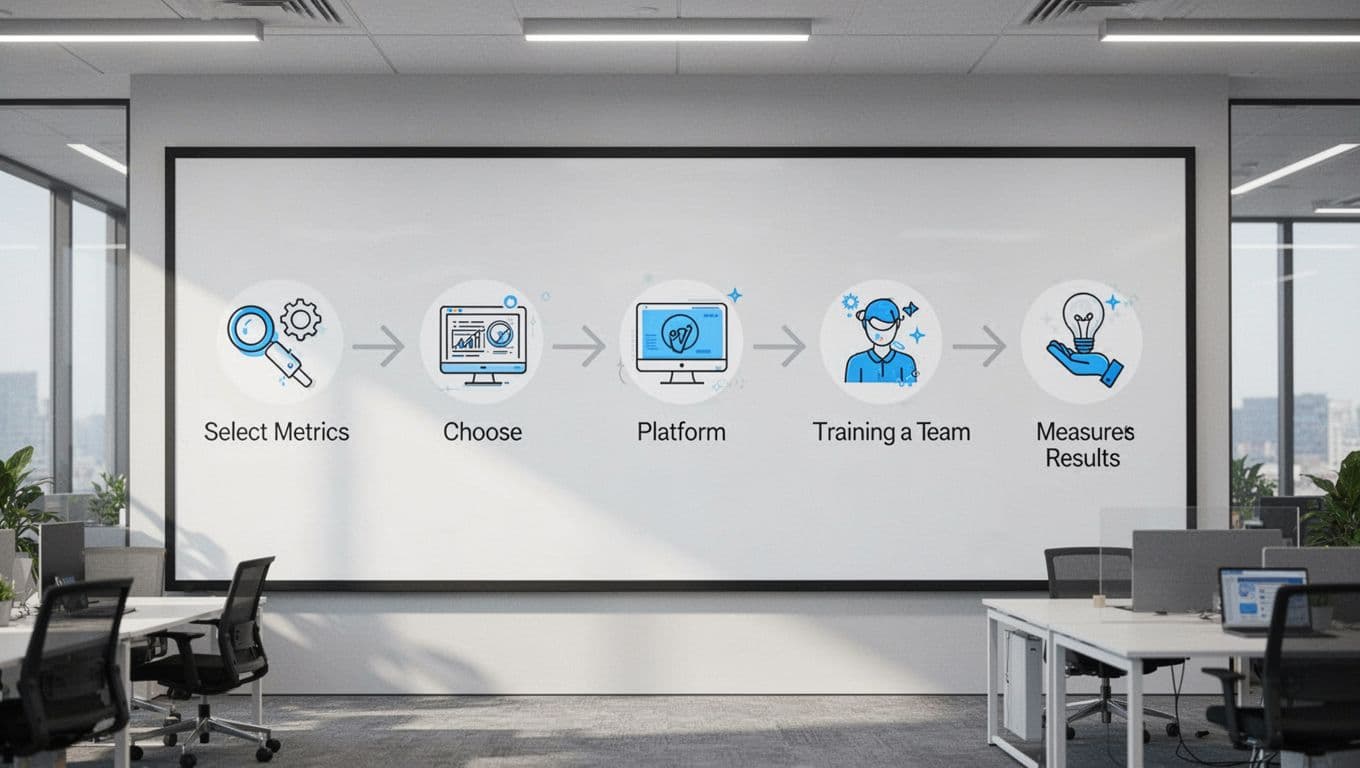
Steps: choose metrics. Pick platform. Train teams. Measure VOI.
Tools help. Look at HR dashboard examples for 2026. McKinsey-style integrations work.
Picking the Right Tools and Starting Small
Integrate with HR tech. AI tools like wellbeing AI dashboards predict smart.
Core metrics first: burnout, engagement. Ethical data: anonymize always.
Start small. Scale on wins.
Common Pitfalls to Avoid for Real Results
Don't chase sign-ups. Pair tech with coaching.
Privacy first; breaches kill trust. Ignore? Metrics lie.
Focus action. Results follow.
Leaders Win with Data-Driven Wellbeing
Dashboards shift wellbeing from perks to power. Trends demand it: AI predictions, ISO rules, 20-25% boosts.
Key metrics track burnout, engagement, output. Build ties them to revenue.
Steps keep it simple: pick, integrate, measure.
Audit your data now. Pilot one dashboard. Teams thrive. Success follows.
Future-proof with ecosystems. 2026 rewards the prepared. You lead.